General topics
Energy efficiency in filtration: assess the complete system
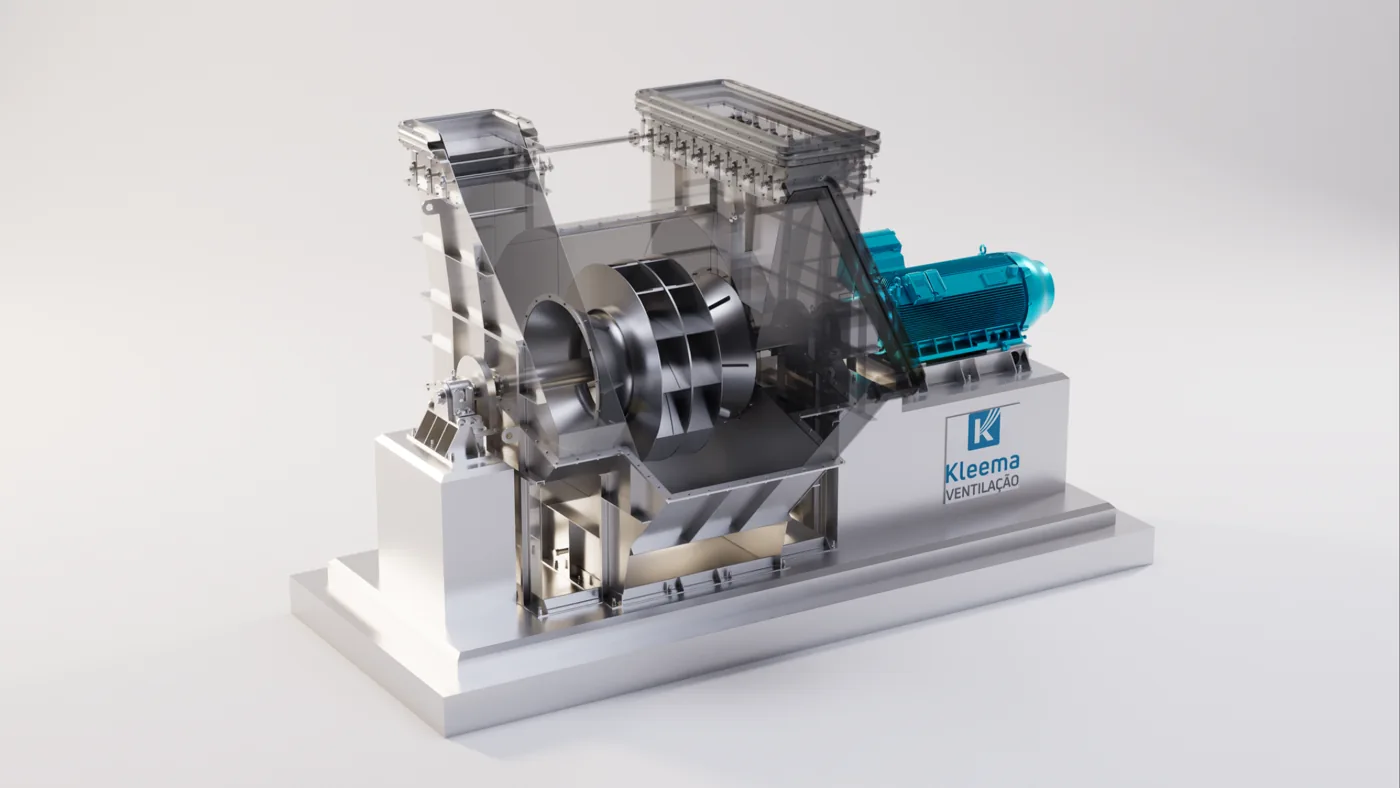
The energy consumption of a dust extraction system results from the flow rate moved, flow resistance and efficiency of the ventilation assembly. Assessment must also include the compressed air used to clean the filter.
The process and emission sources
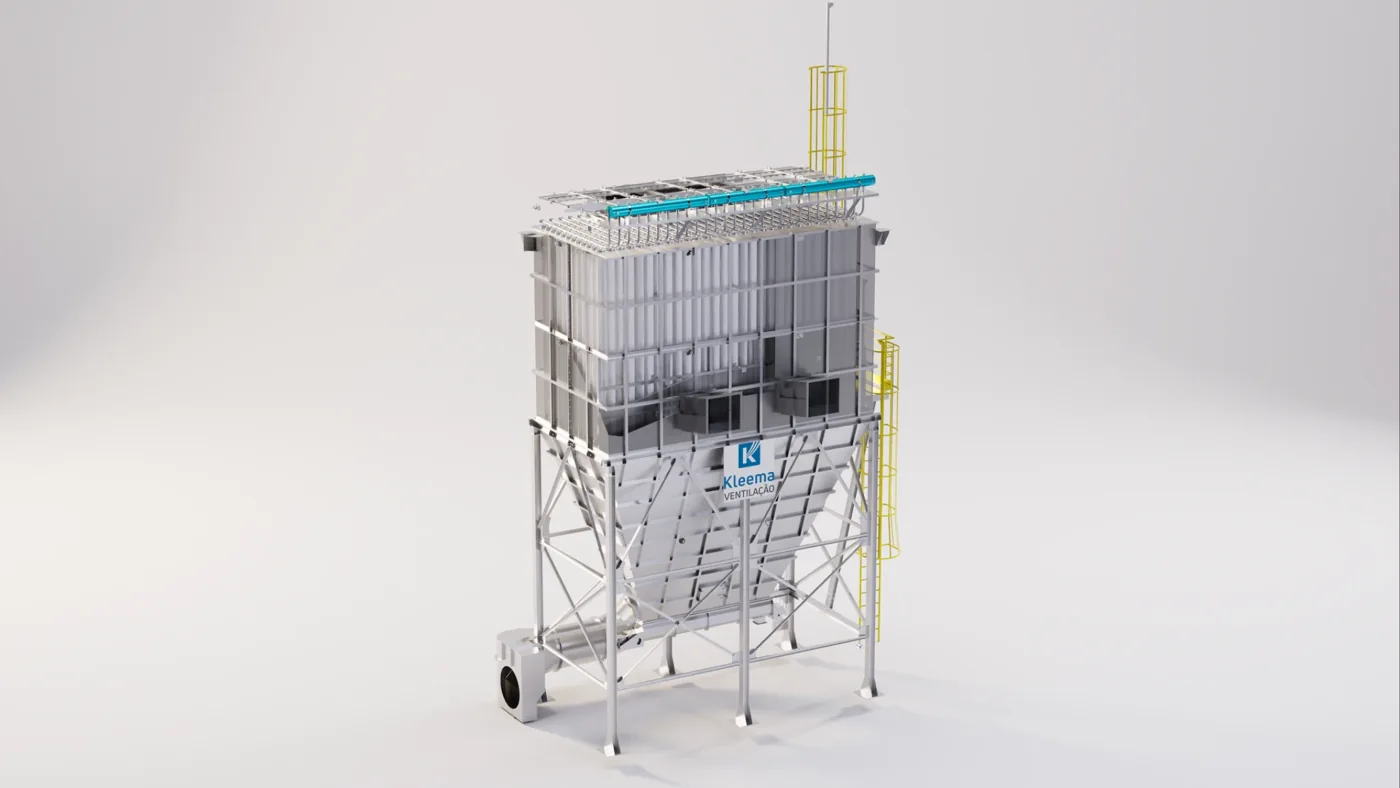
The fan provides energy to overcome circuit resistance, and the filter requires additional energy for cleaning when it uses compressed air. Assessment must start with a system balance: what flow rate is needed at each source, where the losses occur and how the assembly behaves throughout production.
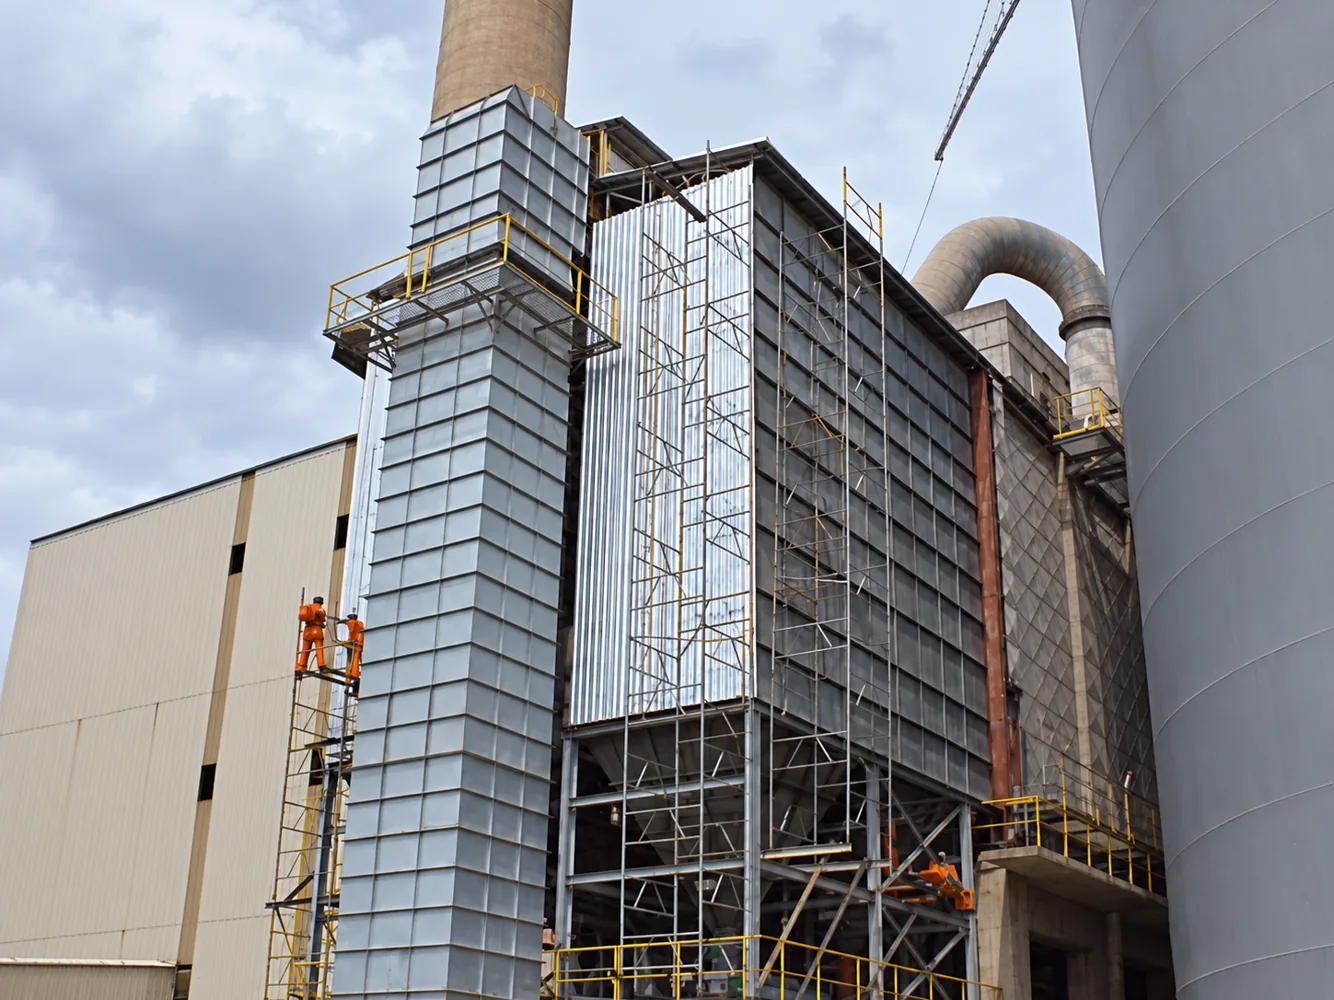
Some consumption may relate to air extracted without a useful purpose, through leaks, idle capture points or excessive openings. Another part may result from high resistance in ducts, dampers and filter elements. Reducing power without maintaining the capture function does not represent a gain in process efficiency.
Characteristics that guide engineering
Reducing losses in hoods, branches and filter inlets can be as significant as replacing the fan. Cleaning control must balance dust-layer resistance and air consumption, avoiding adjustments that impair retention.
Solution configuration and sizing
Power transferred to the flow can be estimated as Q × Δp, using flow rate in m³/s and pressure in Pa, giving watts. Required shaft and electrical input power depend on the efficiencies of the fan, transmission, motor and drive. This relationship illustrates why flow rate, pressure drop and efficiency must be assessed together.
Opportunities include improving inlets and transitions, reviewing branches, reducing false air ingress and selecting the fan for the required range. Speed control can accommodate variable demand, but must respect dust transport, stability and mechanical limits. In cleaning, the objective is to remove the dust layer as much as necessary without wasting air to compensate for a condensation or distribution problem.
Design parameters
| Parameter | How to assess it | Engineering decision |
|---|---|---|
| Useful airflow and false air ingress | Map consumption by circuit | Avoid moving air without a useful purpose |
| Pressure and efficiency | Relate losses to the curve | Assess required power |
| Specific energy consumption | Compare equivalent production and service | Demonstrate verifiable savings |
- Measure flow rate, pressure and power under comparable conditions.
- Check false air ingress and idle branches.
- Assess speed adjustment.
- Compare costs over the operating period. Savings percentages depend on measurements and the reference scenario.
Performance, diagnostics and maintenance
An economic comparison must establish the same capacity and service conditions. It is useful to record flow rate at each source, production, power and compressed-air consumption before and after. An indicator per unit produced can help, provided changes in raw material and operating regime are considered.
There is no universal savings percentage from replacing a fan, bags or controls. The calculation must include annual hours, input costs, maintenance and investment. Emissions and capture must remain within defined criteria; a consumption reduction achieved by worsening extraction should not be presented as optimization.
Illustrative example: reducing pressure drop while maintaining flow rate
Suppose an installation operates at 60,000 m³/h, a total pressure drop of 2,000 Pa and a hypothetical overall efficiency of 65%, including the losses considered in supplying power to the assembly. The flow rate is approximately 16.67 m³/s. Estimated power is P = Q × Δp ÷ η = 16.67 × 2,000 ÷ 0.65 ≈ 51.3 kW.
If a review of ducts and transitions reduced resistance to 1,600 Pa while maintaining the same flow rate and efficiency, calculated power would be approximately 41.0 kW. The difference of 10.3 kW would correspond to about 61.5 MWh over 6,000 annual operating hours. These are hypothetical values explaining the relationship, rather than a result attributed to Kleema.
Savings materialize only if the operating point is adjusted to the intended condition. In an installation without that adjustment, reducing resistance may increase flow rate and produce a different consumption level. Compressed air, utilities and maintenance must be added to assess the complete project.
Economic comparison
The return on an intervention must account for operating hours, energy costs, compressed air and maintenance. A consistent comparison uses the same production capacity and equivalent conditions, avoiding attributing savings to an unintended reduction in capture.
Further technical reading
Does your process need an assessment?
Talk to Kleema engineering about sizing, modernization and operating conditions.
Talk to engineering ↗